
Over multiple generations of CMIP models Arctic sea ice trend predictions have gone from much too stable to about right. Why?
The diagnostics highlighted in our model-observations comparison page are currently all temperature based, and show overall that climate models have being doing well on these trends for decades. But there has been increasing attention to trends in non-temperature variables, and there, model performance is more mixed (Simpson et al., 2025). As we’ve discussed before, model-observation discrepancies can arise from three causes: the observations could be wrong (unrealized biases etc.), the models are wrong (which can encompass errors in forcings as well as physics), or the comparison could be inappropriate.
One of the most high profile ‘misses’ in coupled modeling over the last few decades was the failure of the model projections in CMIP3 (circa 2003/4 vintage) to match the rapid losses in Arctic sea ice that started to become apparent in the middle of that decade (Stroeve et al., 2007), and were compounded by the summertime record losses of sea ice in 2007 and then 2012. With an additional decade, how does that look now?
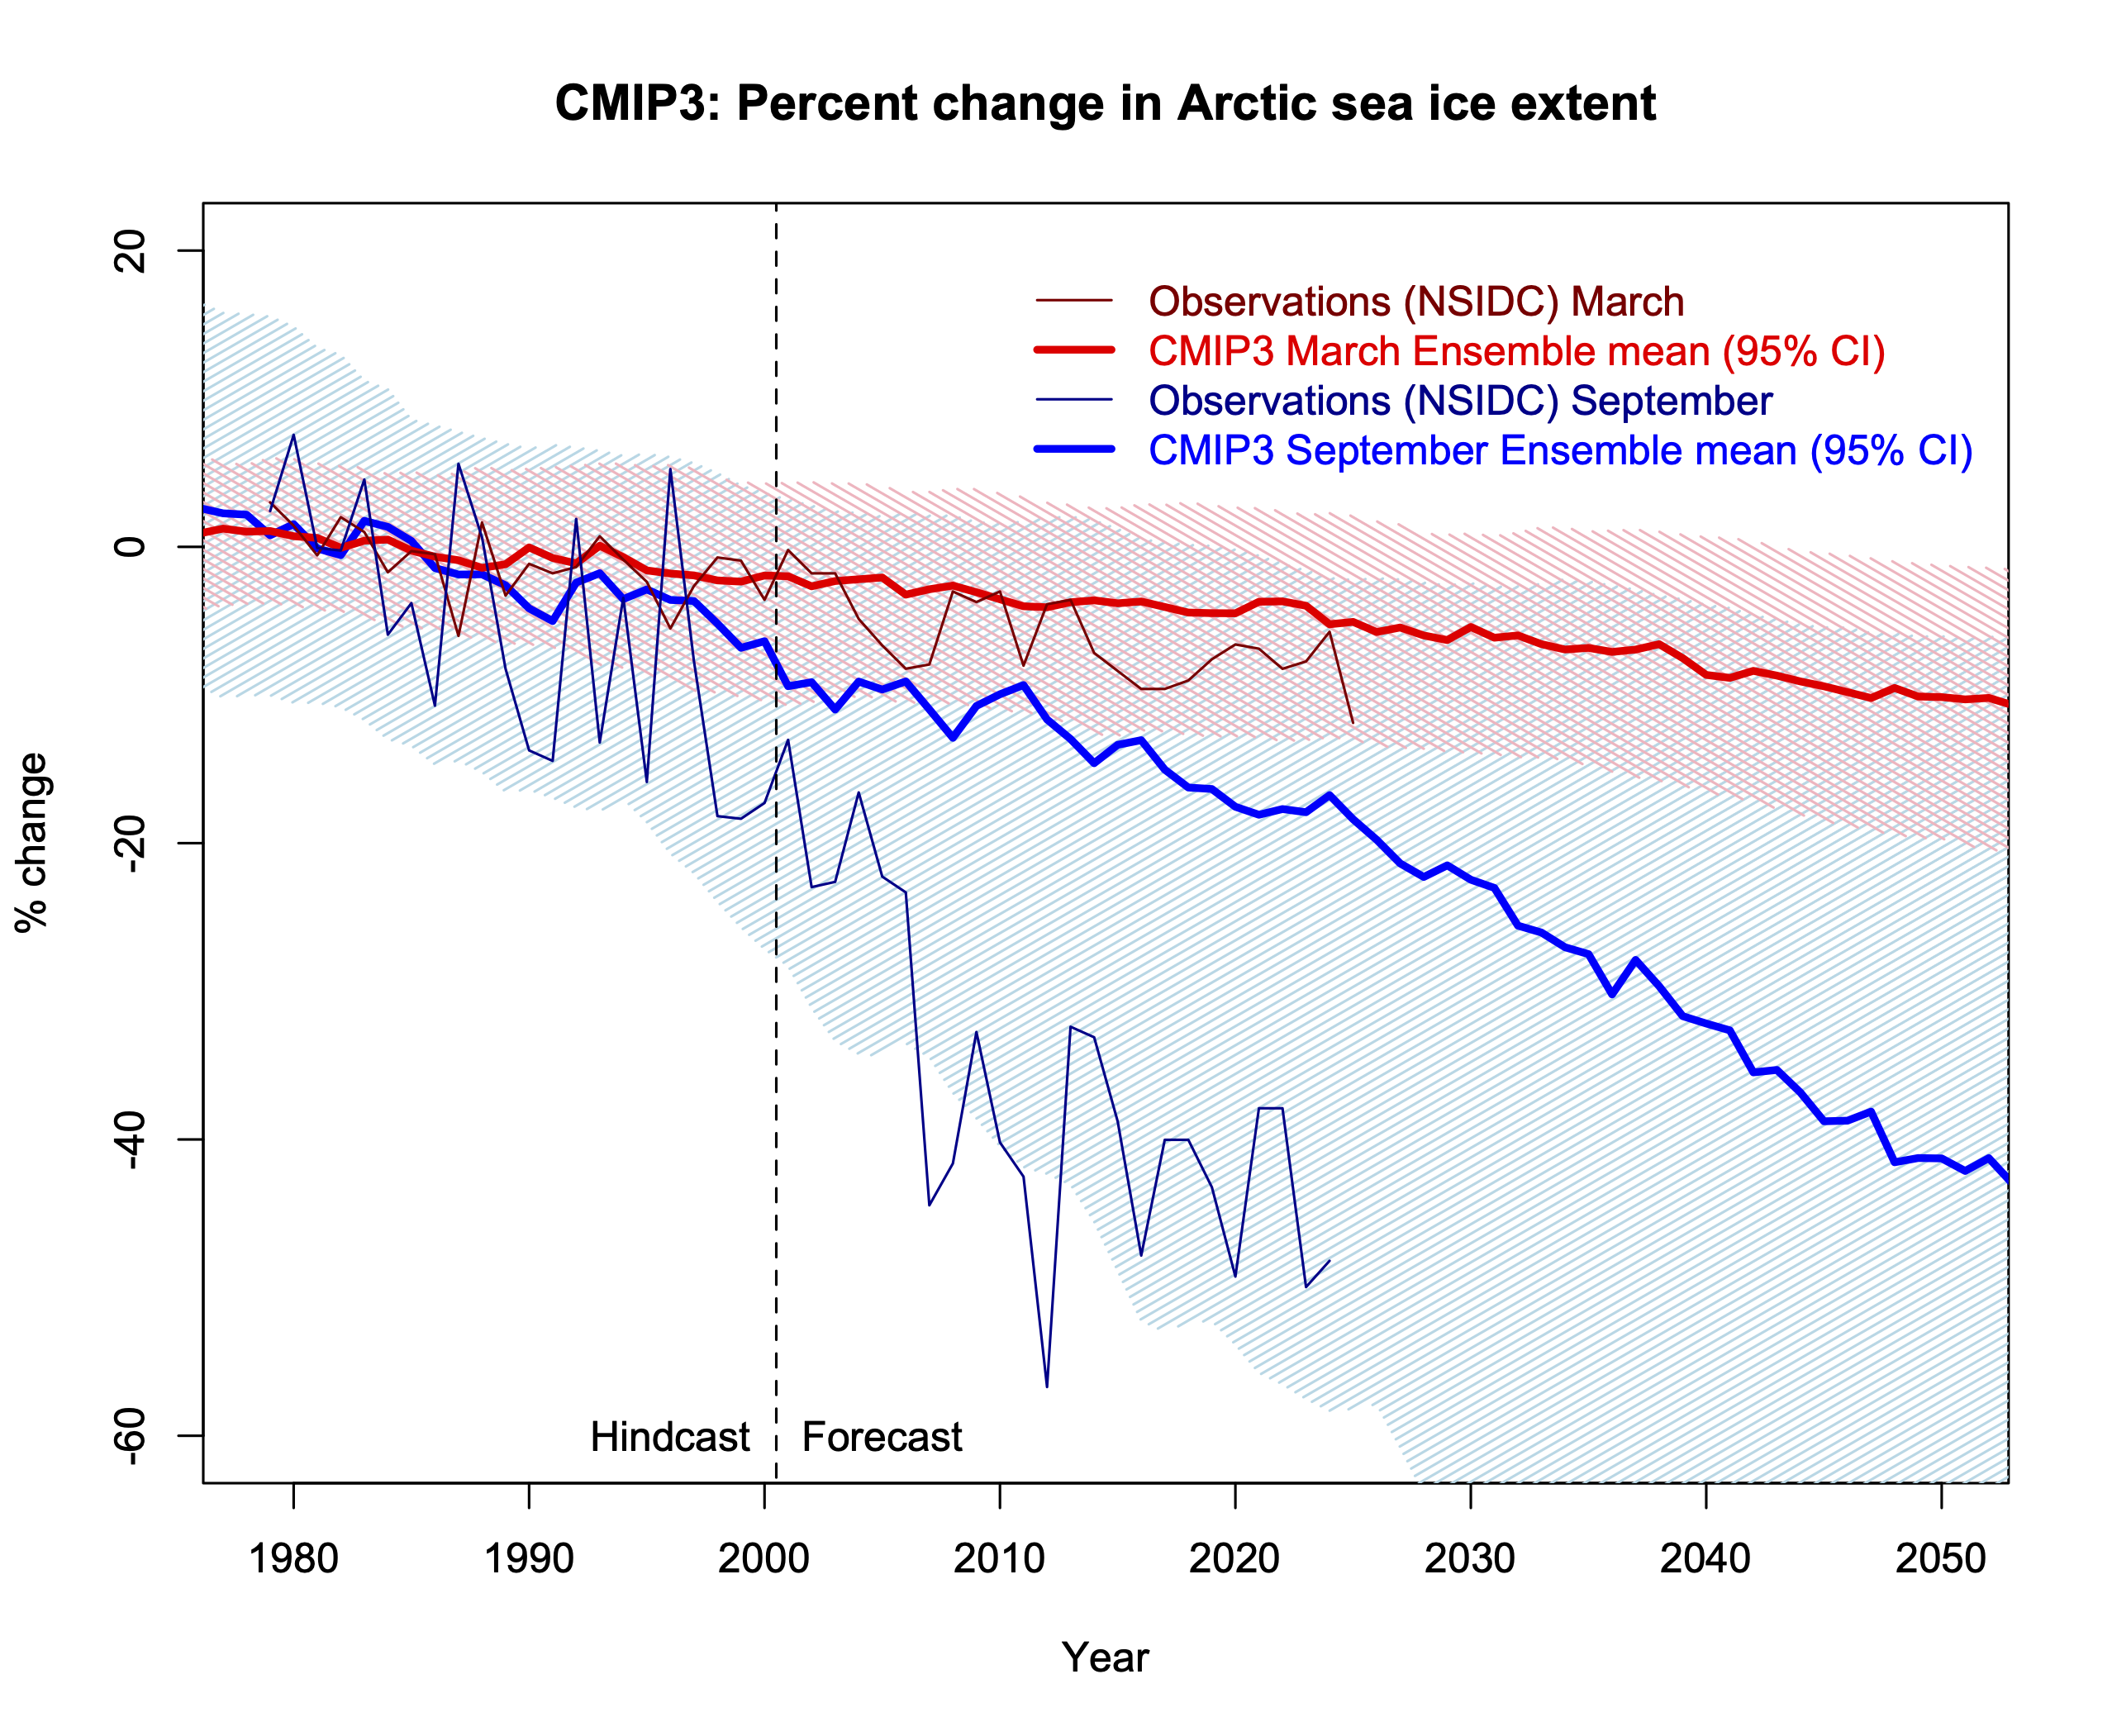
In a word, the CMIP3 Arctic sea ice projections were, and remain, terrible. The ensemble mean predicted rate of change of September Arctic sea ice extent is less than half that observed (-4.5 %/decade vs. -11 %/decade for 1979-2024), and there are only five single individual model simulations (out of 46) that have a loss rate greater than 10 %/decade (95% spread is [-12,-0.7] %/decade). The March trends are also under-predicted, but by a lesser degree. There is no real ambiguity in the observed trends, nor in the comparison (though extent is a little trickier than area to compare to), and so these discrepancies were very likely due to model failures – insufficient resolution to capture the polar sea ice dynamics, too simple sea ice physics, biases in the Arctic ocean simulations etc. Analyses have shown that errors in the absolute amount of sea ice were correlated to the errors in the trends as well.
Development of the CMIP5 models was ongoing as these discrepancies were manifesting, and there were improvements in sea ice physics and dynamics, increased resolution and a reduction in the overall climate biases. The simulations in CMIP5 were conducted around 2011-2013, and used historical forcings from to 2005, and scenarios subsequently. Did that make any difference?
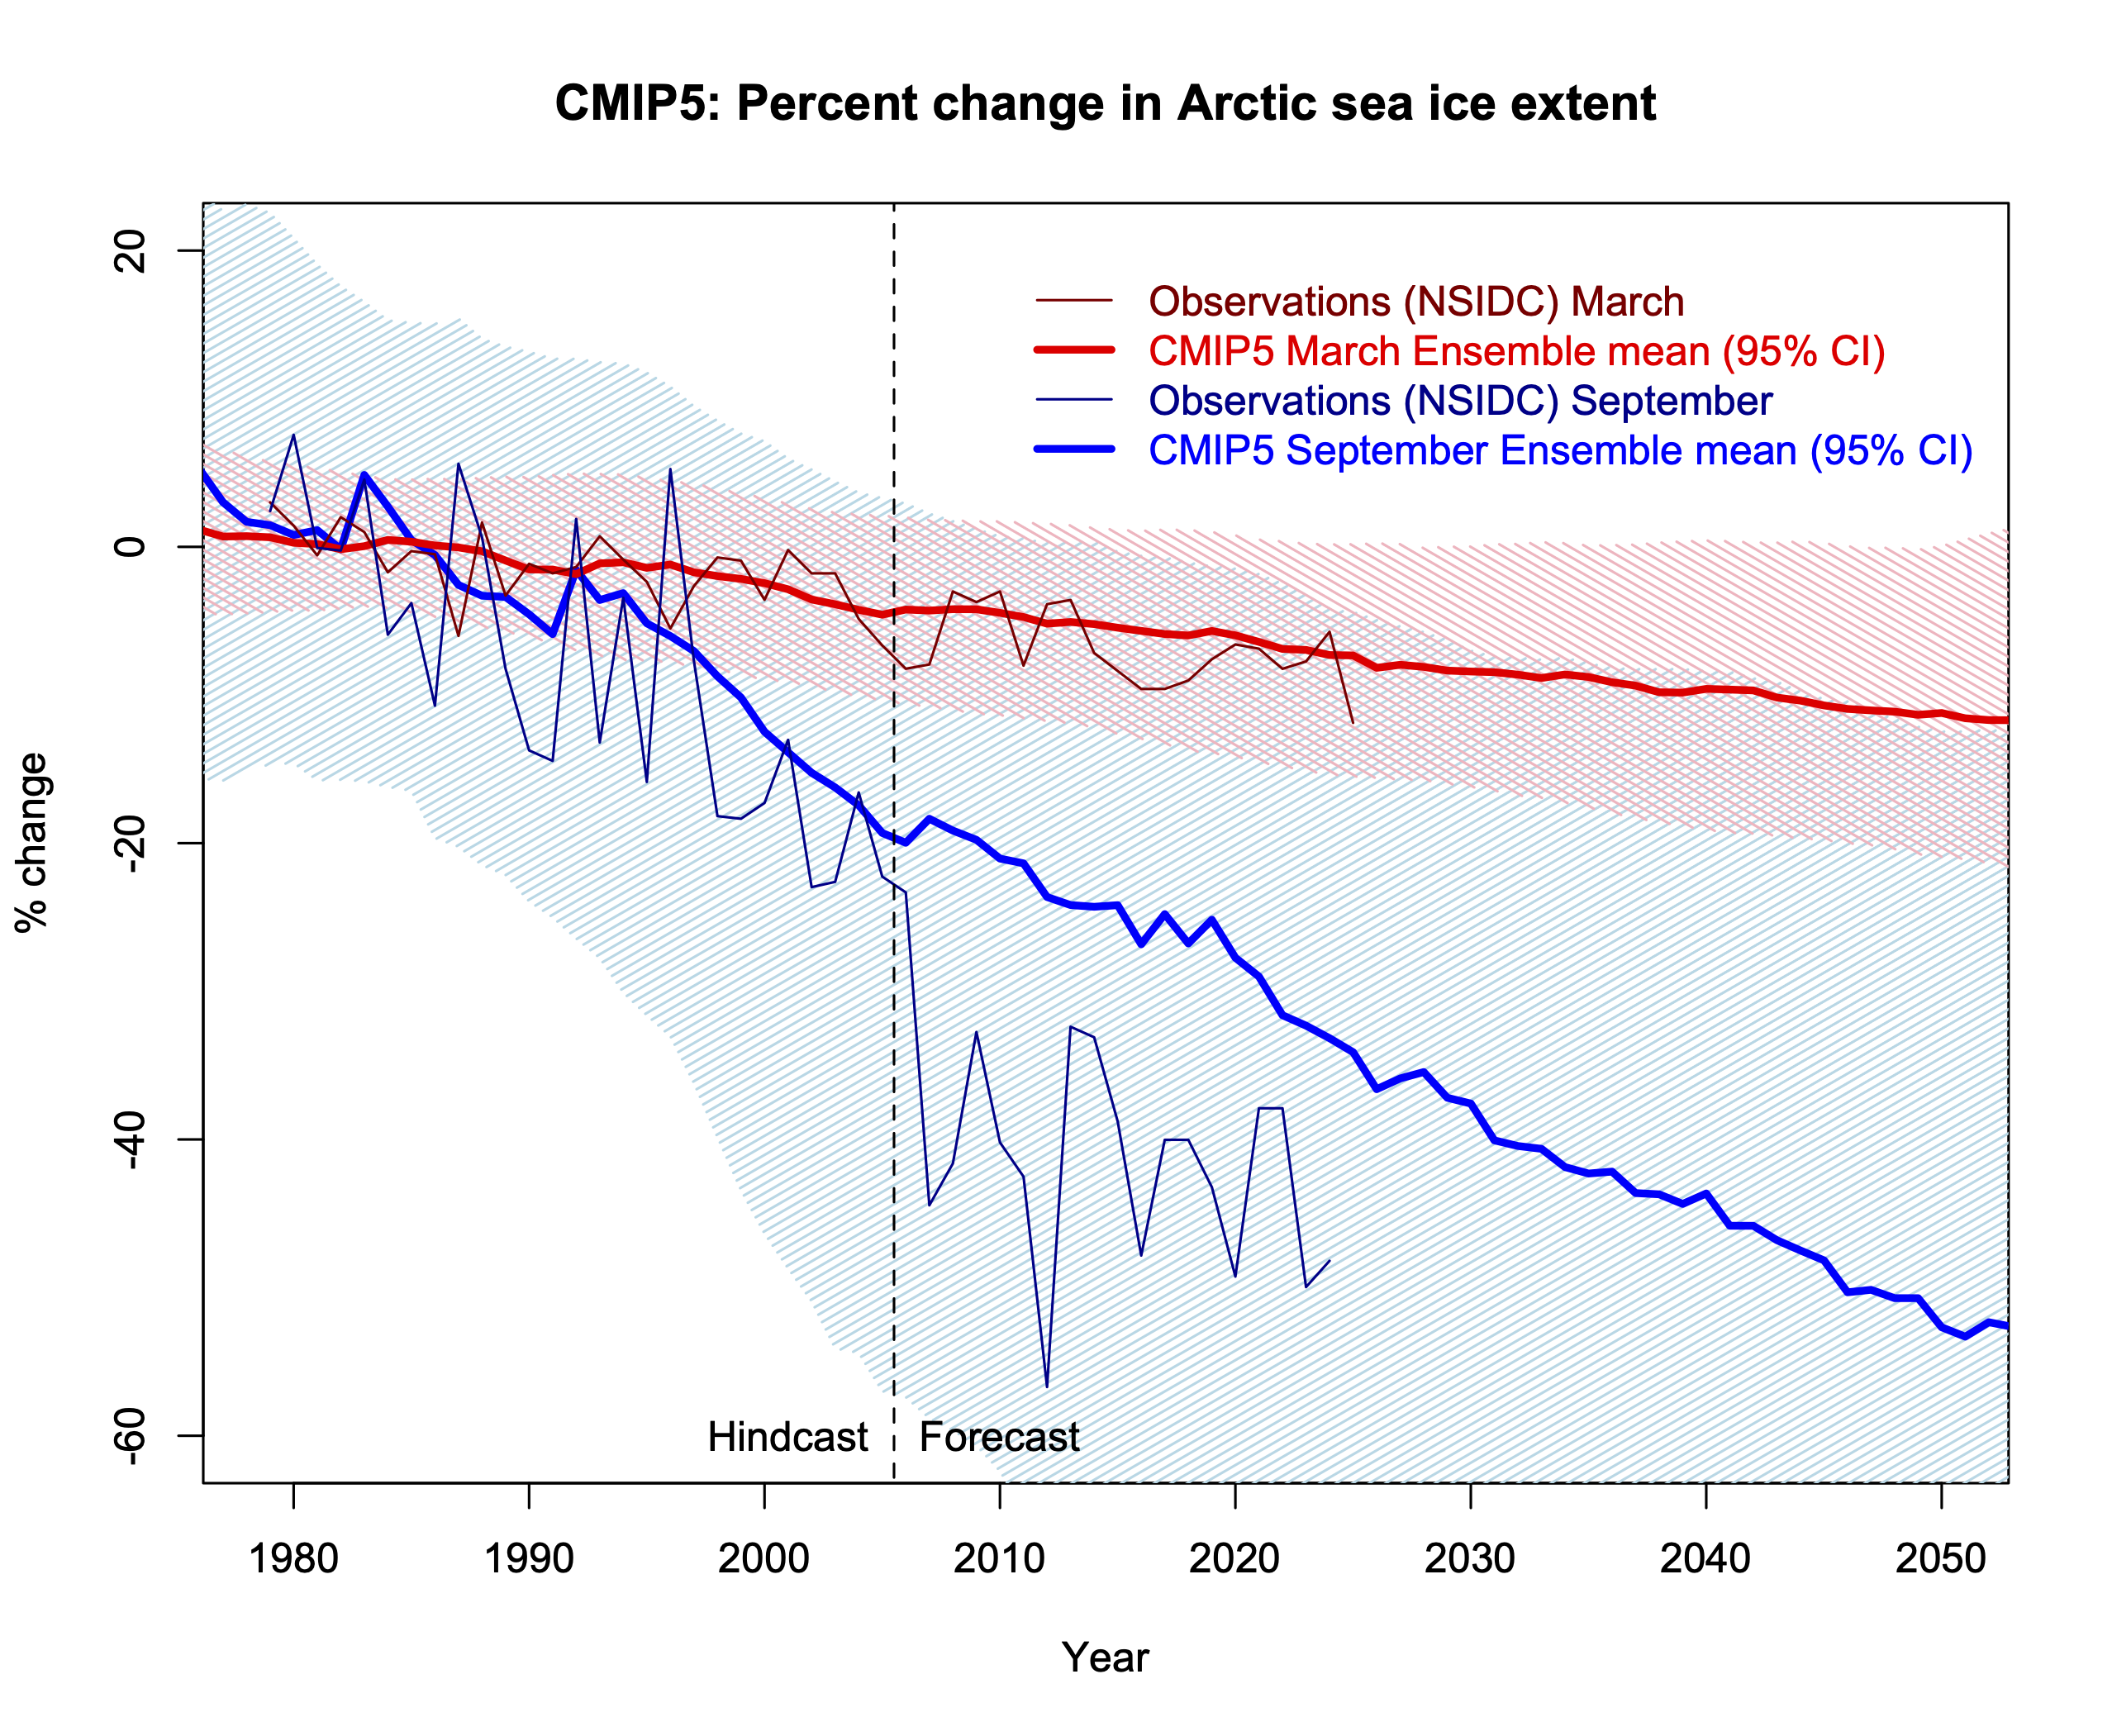
Closer, but no cigar. The spread in the CMIP5 models is larger (a function of greater variability), and the observations are now more within the spread, but the September ensemble mean trend (-8%/decade) is still a bit too low. But nearly 40% of the 107 individual simulations (95% CI is [-20,-1.4]%/decade) now have losses greater than 10%/decade. The March trends are mostly well represented, but there are still large variations in the absolute extent.
There was a longer gap before CMIP6, but those models were developed through to 2017/8 or so, and so developers were well aware of the ongoing discrepancies (Stroeve et al., 2012). Again, there were improvements in sea ice physics, dynamical schemes, forcings (the addition of black carbon impacts on snow and ice albedo for instance), and again, improvements in resolution and in the base climatology.
As a minor aside, from 2007 to 2014 there was a spate of un-peer reviewed claims from a few scientists (Peter Wadhams and Wiesław Masłowski notably) that used non-linear statistical fits to the observed sea ice indices to predict essentially ice-free conditions by 2013, or 2016 or so. These predictions were not based on any physical insight or model, were heavily criticised by other scientists at the time (I recall a particularly spicy meeting at the Royal Society in 2014 for instance!), and (unsurprisingly) were not validated. But this kind of stuff is perhaps to be expected when the mainstream models are not providing credible projections?
Anyway, back to CMIP6. Third time’s a charm?

Actually, this isn’t bad. The CMIP6 ensemble mean for September area trends is now -11 %/decade (observed 13 %/decade) and the March trends are spot on. Note that the observed loss in ‘area’ is slightly larger than the trend in ‘extent’ (13 %/decade vs. 11 %/decade) and I’m using area here because that is what is available. The spread for September trends is [21,3] %/decade which is slightly tighter than in CMIP5, and 40% (again) have losses greater than 10 %/decade.
What lessons can be drawn here?
As we have often stated, models are always wrong, but the degree to which they can be useful needs to be addressed – by variable or by model generation or by model completeness etc. The utility of the CMIP6 ensemble (and presumably the upcoming CMIP7 models) for Arctic sea ice is clearly higher than the CMIP3 ensemble, but there doesn’t appear to be a single thing that needed to be fixed for that to happen. Rather, an accumulation of improvements – in physics, resolution, completeness, forcings – have led to a gradual improvement in skill (not just in the sea ice trends!).
As Simpson et al (2025) noted, there are increasing numbers of climate quality diagnostics that have long enough time series and emerging signals of change, such that there are an increasing number of tests for the model trends. The history of Arctic sea ice comparisons shows that it might be premature to conclude that any specific discrepancies imply that something is fundamentally wrong, or that climate modeling is in a ‘crisis’ (Shaw and Stevens, 2025), it may well be that these discrepancies will resolve themselves in the course of ‘normal’ model development (and as the observed signals become clearer). Or not ;-).
Note on sources: CMIP3 (Mar, Sep) and CMIP5 (historical, rcp45) processed extent data are from Jacob Dörr (Notz et al, 2020) and Alex Jahn (via Julienne Stroeve and Patricia Derepentigny), and the CMIP6 area data is from the U. of Hamburg data portal (courtesy of Dirk Notz). Ensemble means are over the whole ensemble with one simulation = one vote. Also I haven’t screened the CMIP6 models by climate sensitivity (as I’ve done for the temperatures). These choices might make small differences, but not effect the main conclusions.
References
I.R. Simpson, T.A. Shaw, P. Ceppi, A.C. Clement, E. Fischer, K.M. Grise, A.G. Pendergrass, J.A. Screen, R.C.J. Wills, T. Woollings, R. Blackport, J.M. Kang, and S. Po-Chedley, “Confronting Earth System Model trends with observations”, Science Advances, vol. 11, 2025. http://dx.doi.org/10.1126/sciadv.adt8035
J. Stroeve, M.M. Holland, W. Meier, T. Scambos, and M. Serreze, “Arctic sea ice decline: Faster than forecast”, Geophysical Research Letters, vol. 34, 2007. http://dx.doi.org/10.1029/2007GL029703
J.C. Stroeve, V. Kattsov, A. Barrett, M. Serreze, T. Pavlova, M. Holland, and W.N. Meier, “Trends in Arctic sea ice extent from CMIP5, CMIP3 and observations”, Geophysical Research Letters, vol. 39, 2012. http://dx.doi.org/10.1029/2012GL052676
T.A. Shaw, and B. Stevens, “The other climate crisis”, Nature, vol. 639, pp. 877-887, 2025. http://dx.doi.org/10.1038/s41586-025-08680-1
D. Notz, and S. Community, “Arctic Sea Ice in CMIP6”, Geophysical Research Letters, vol. 47, 2020. http://dx.doi.org/10.1029/2019GL086749
The post Predicted Arctic sea ice trends over time first appeared on RealClimate.